We are excited to announce a powerful new feature now available in the Transmural Platform Console: the API Log Overview. This addition gives Healthcare Organisation administrators unprecedented transparency into the API communication flows that sit at the heart of the Transmural Platform’s integration
Why API Visibility Matters in Healthcare Integration
The Transmural Platform connects Electronic Health Record (EHR) systems with Transmural Care Data Providers, enabling seamless data exchange across organisational boundaries. Under the hood, this means a continuous stream of API calls in two directions: context and referral data flowing from the EHR system towards the Transmural Care Data Provider, and monitoring data flowing back to the healthcare organisation via webhooks.
Until now, administrators had limited insight into whether these calls were succeeding, what data was being exchanged, and whether any errors required follow-up. With the new API Log feature, that changes completely.
What the API Log Overview Offers
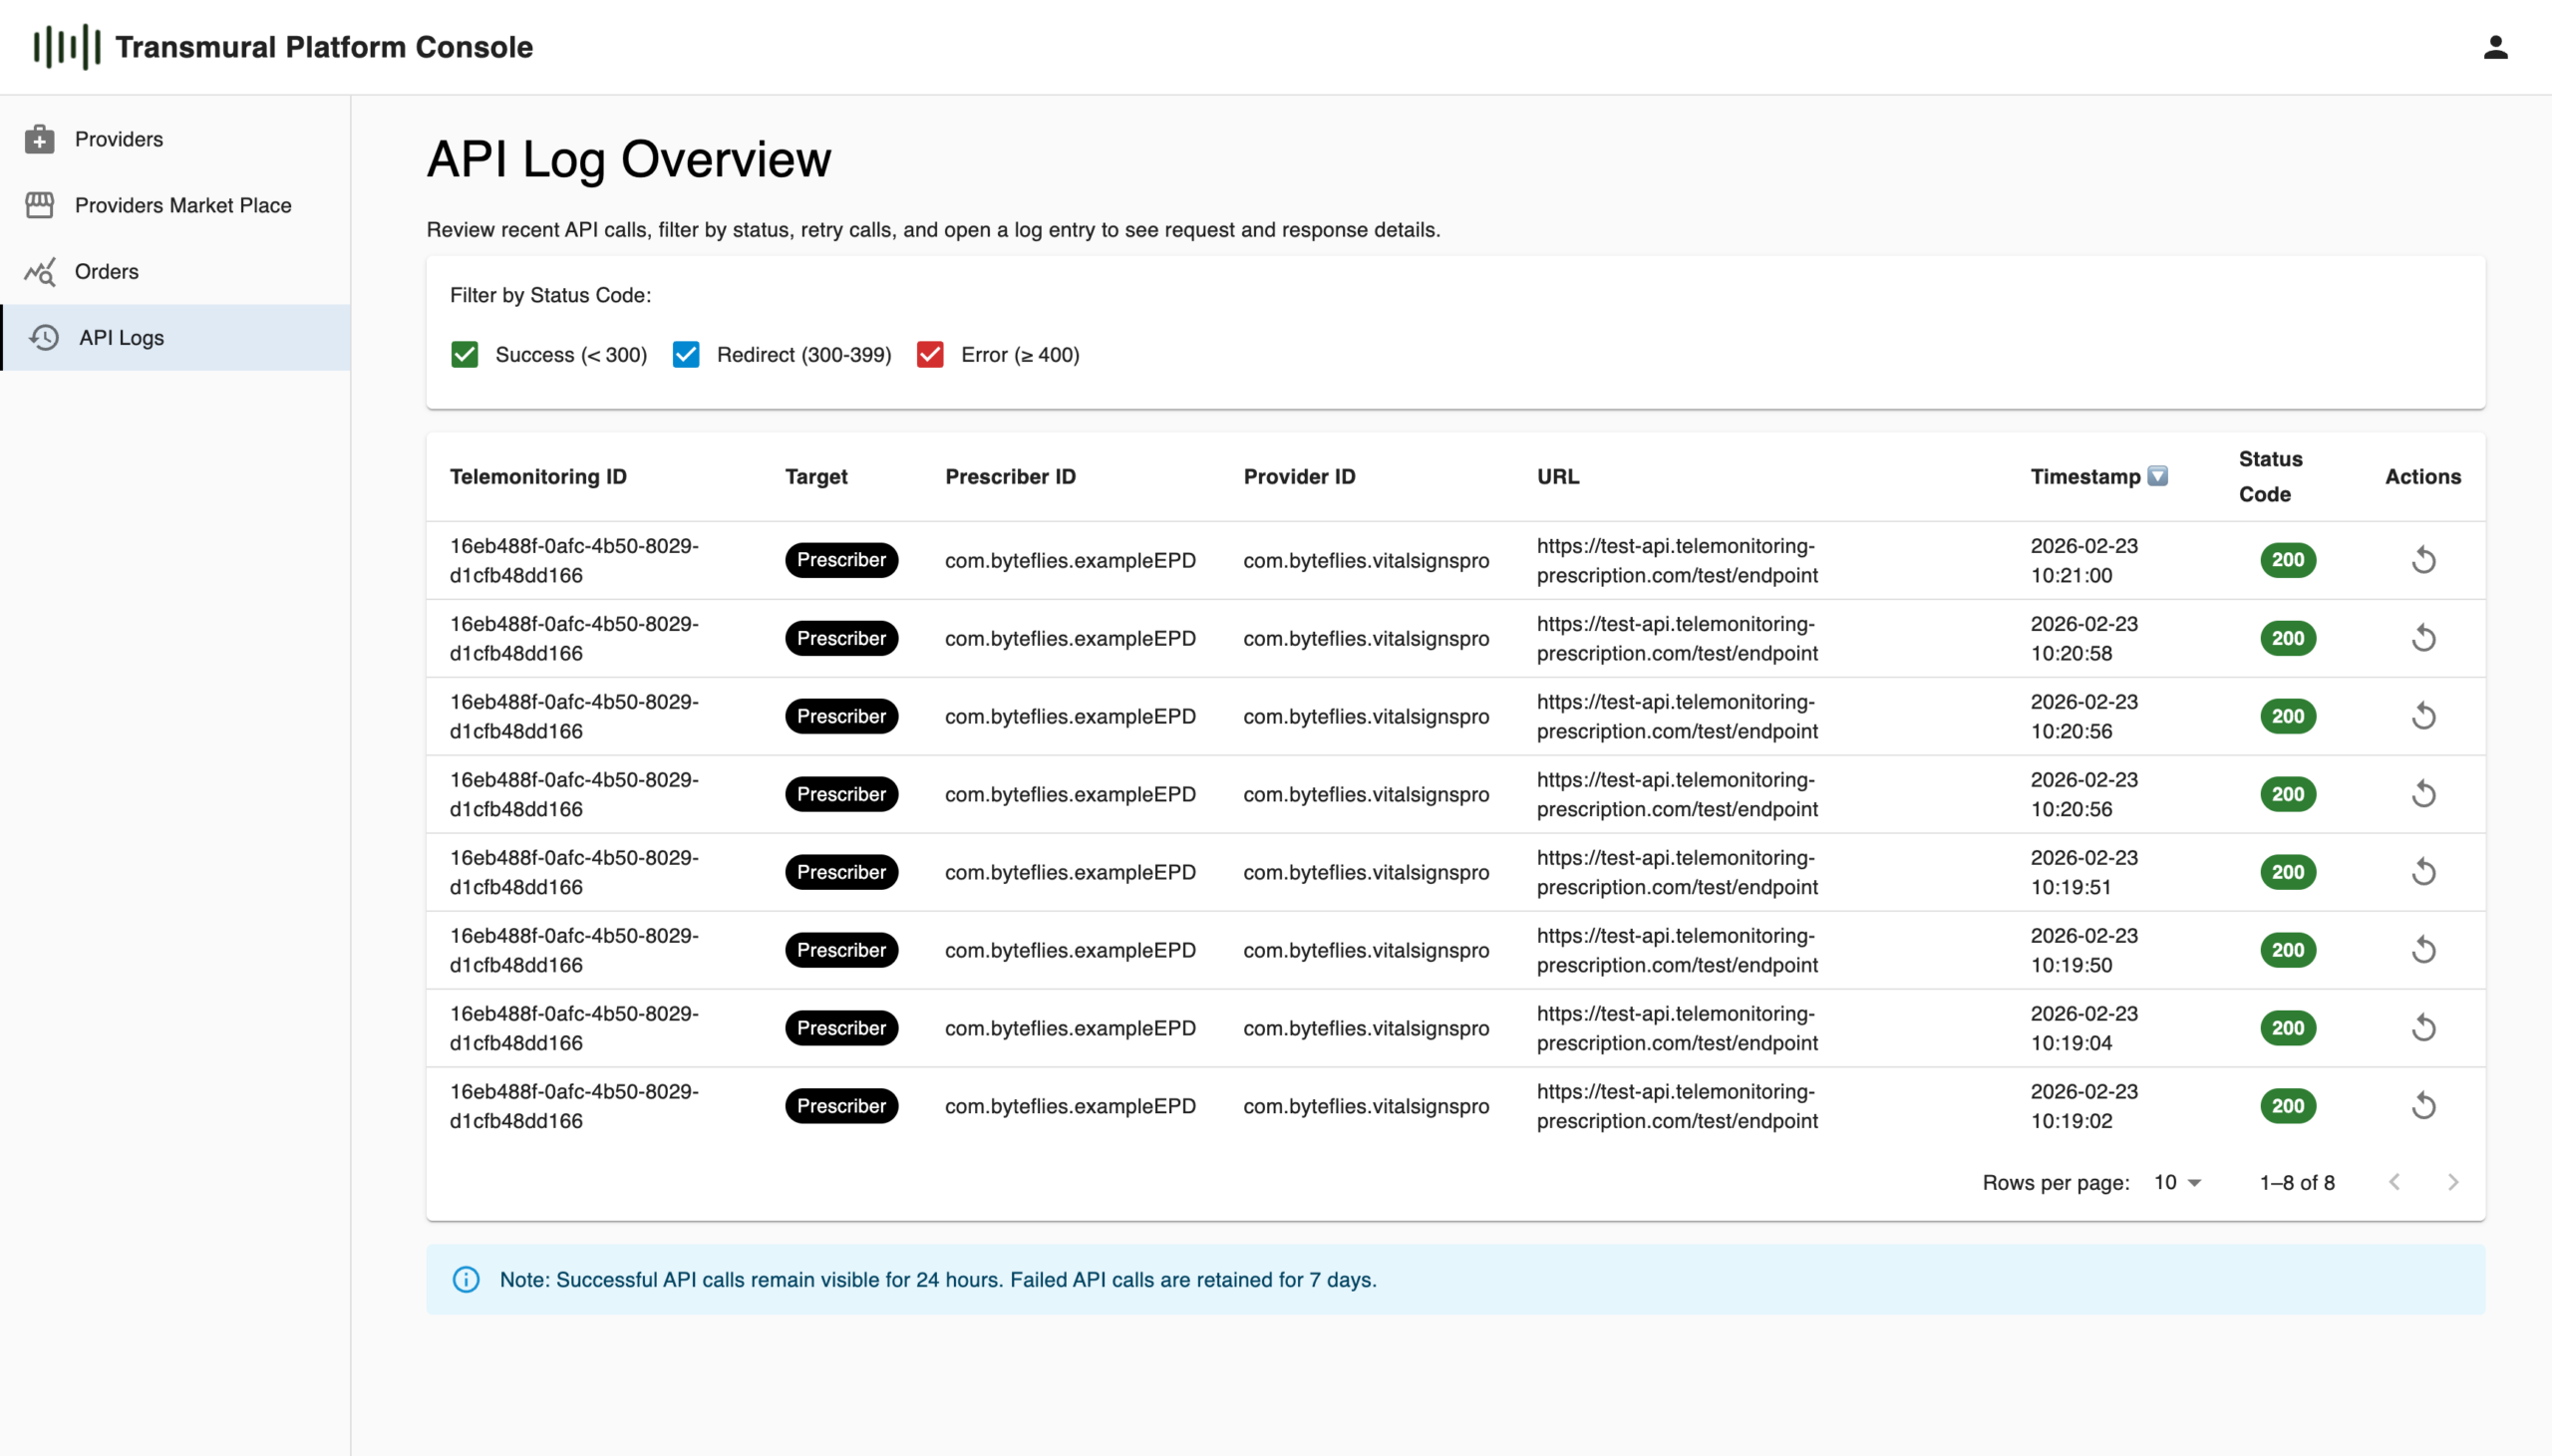
The API Log Overview screen provides a filterable, paginated table of all recent API calls associated with your organisation. For each entry you can immediately see the Telemonitoring ID, the target type (e.g. Prescriber webhook), the Prescriber ID, the Provider ID, the endpoint URL that was called, the exact timestamp, and the HTTP status code. Status codes are colour-coded so that successes (< 300), redirects (300–399), and errors (≥ 400) stand out at a glance.
Filtering by status code class makes it straightforward to focus on what matters most. A quick scan for red badges lets you spot failed calls immediately, without scrolling through a list of healthy 200 responses.
Drilling Into the Details
Clicking into any log entry opens the API Log Detail panel, which shows the full picture of that specific call. Beyond the summary metadata, you get the complete Request Body, including the telemonitoring ID, patient identifier, care path, service identifiers, and the list of attachments sent, as well as the Response Body returned by the receiving endpoint. A Call Counter field also tells you how many times a particular call has been attempted, which is especially useful when investigating retry behaviour.
This level of detail allows administrators and integration teams to quickly diagnose issues, verify that the correct payload is being sent, and confirm that the receiving system responded as expected.
Retry on Demand
Alongside log inspection, the overview includes a retry action for each log entry. If a call failed due to a transient issue on the receiving end, administrators can trigger a retry directly from the console without requiring any developer intervention.
Retention Policy
To keep the log manageable while ensuring failed calls remain available for investigation, the platform applies a straightforward retention policy: successful API calls are visible for 24 hours, while failed calls are retained for 7 days.
Getting Started
The feature is available now in the Transmural Platform Console under the API Logs menu item. No configuration is required, as logs are captured automatically for all API calls processed through the platform.
If you have questions or would like a walkthrough, feel free to reach out to the Transmural Platform support team or visit www.transmuralplatform.eu.
Leave a Reply